
Setting the scene
We often tend to take for granted that diesel cars pollute and electrical vehicle are clean. Is it true though? Or is it a bit more complex?
This article presents in a straightforward way the Global Warming Potential (GWP) of different energy sources and power generators. It simplifies things to make the content accessible and is therefore not a scientific review. Nevertheless, we have used real and factual data with sources clearly mentioned in the annexes. At Inergio, we develop fuel cell systems and we take our environmental impact very seriously. It’s a 5 min read without the annexes.
How do we measure and compare greenhouse gas impact?
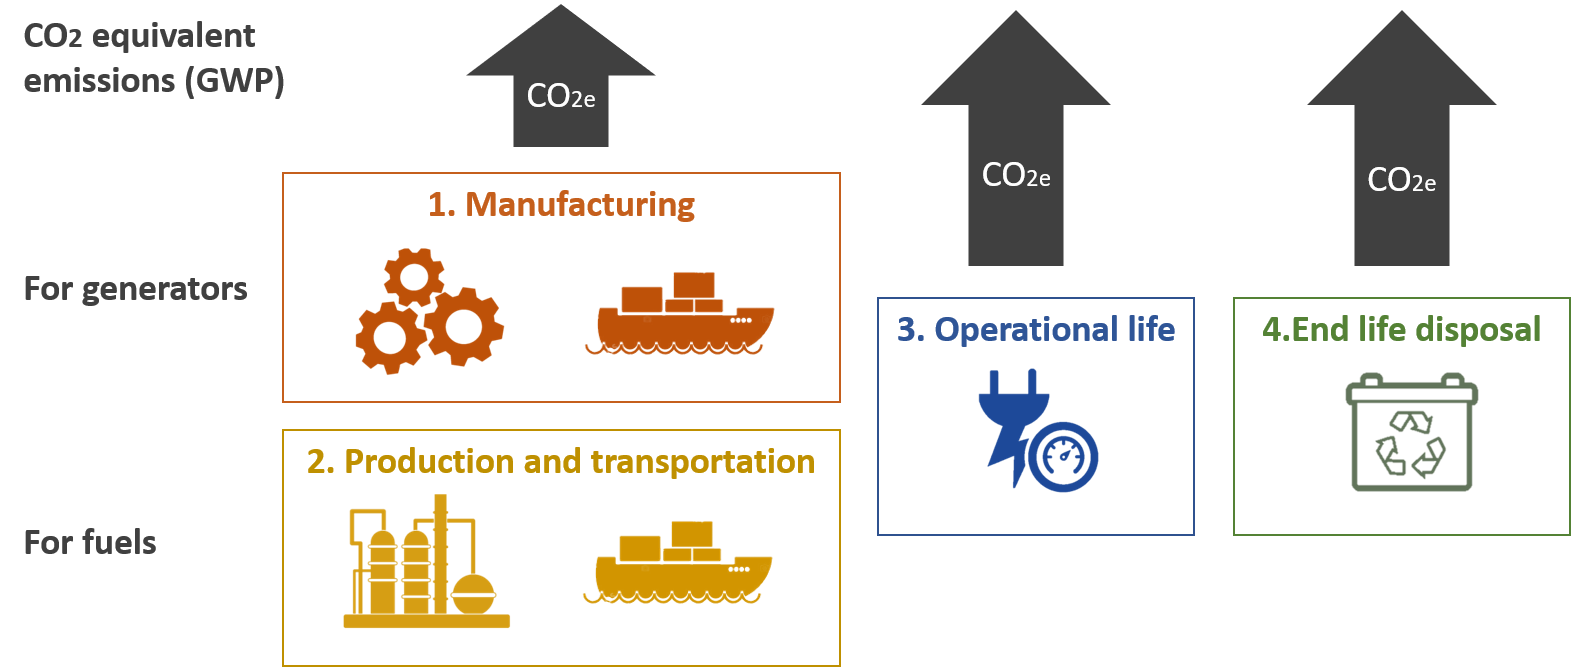
We only tend to consider the emission of greenhouse gas during consumption. For example, a car motor is on, fuel is consumed, some CO₂ and other emissions are generated. Nevertheless, the production, maintenance and disposal for the different type of generators need to be considered altogether.
Total Greenhouse Gas emissions are analyzed over 3 phases:
- Production impact: a fuel or a motor have an impact linked to their production methods and during their installation. Example: transport and installation of wind turbine require quite some energy.
- Operational phase impact: when an energy system is used or a fuel is consumed, there is an associated impact.
- End of life and disposal: removing and disposing of a generator also has an impact. For example, Lithium batteries are hard to recycle and therefore have an important impact at this stage.
Global Warming Potential (GWP) is measured in grams or kg of CO₂ equivalent (abbreviated by CO₂-eq). Emissions which aren’t CO₂ are converted to CO₂ equivalent depending on their environmental impact. For example, methane’s effect on the climate is 28 times more severe than CO₂. Similarly, nitrous oxide is considered more impactful than CO₂ almost 300-fold.
CO₂-eq grams of emission per kWh of energy produced is the standardized way of comparing the global warming potential (GWP) of various energy sources. Units used in this article are explained in detail in annexes.
We will focus especially in this article on production and operation impact. Maintenance and end-of-life will be mainly mentioned in a qualitative way. We can consider more parameters in a full life cycle assessment (LCA) but we will mainly focus on the Global Warming Impact (GWP).
Summing up (starting from the conclusion)
Unlike many articles, we’ll start with the final results per energy source. If you’re seeking more detailed information, everything is available in the annexes.
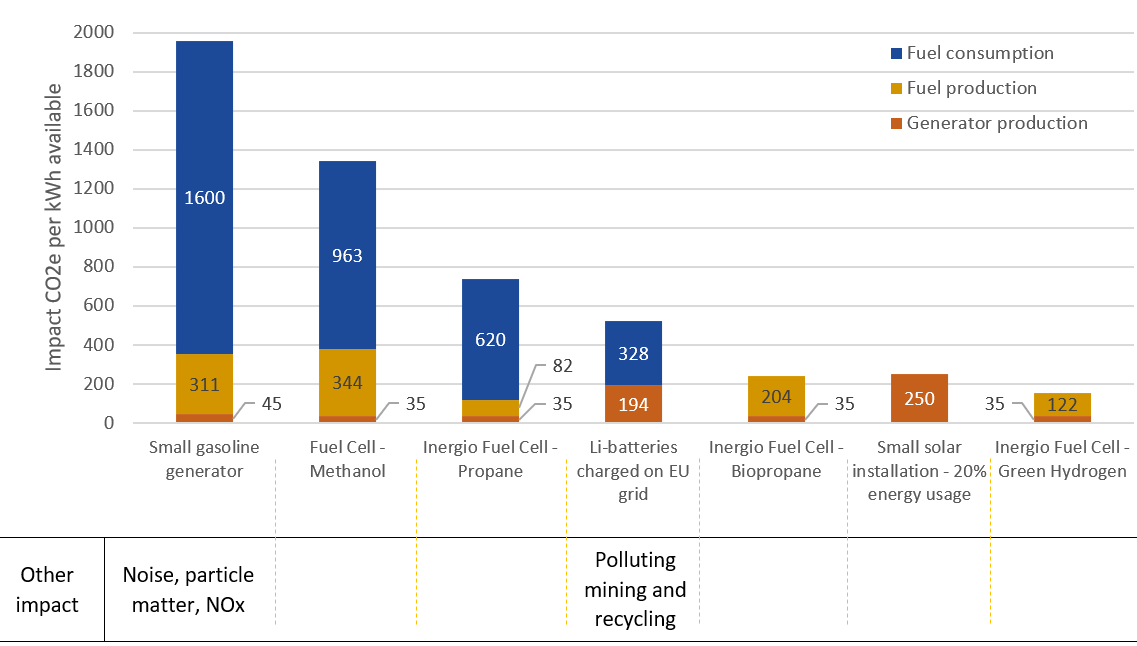
To make more meaningful comparisons, we separate two type of power generation:
- Off-grid power, commonly smaller and less efficient electricity production means
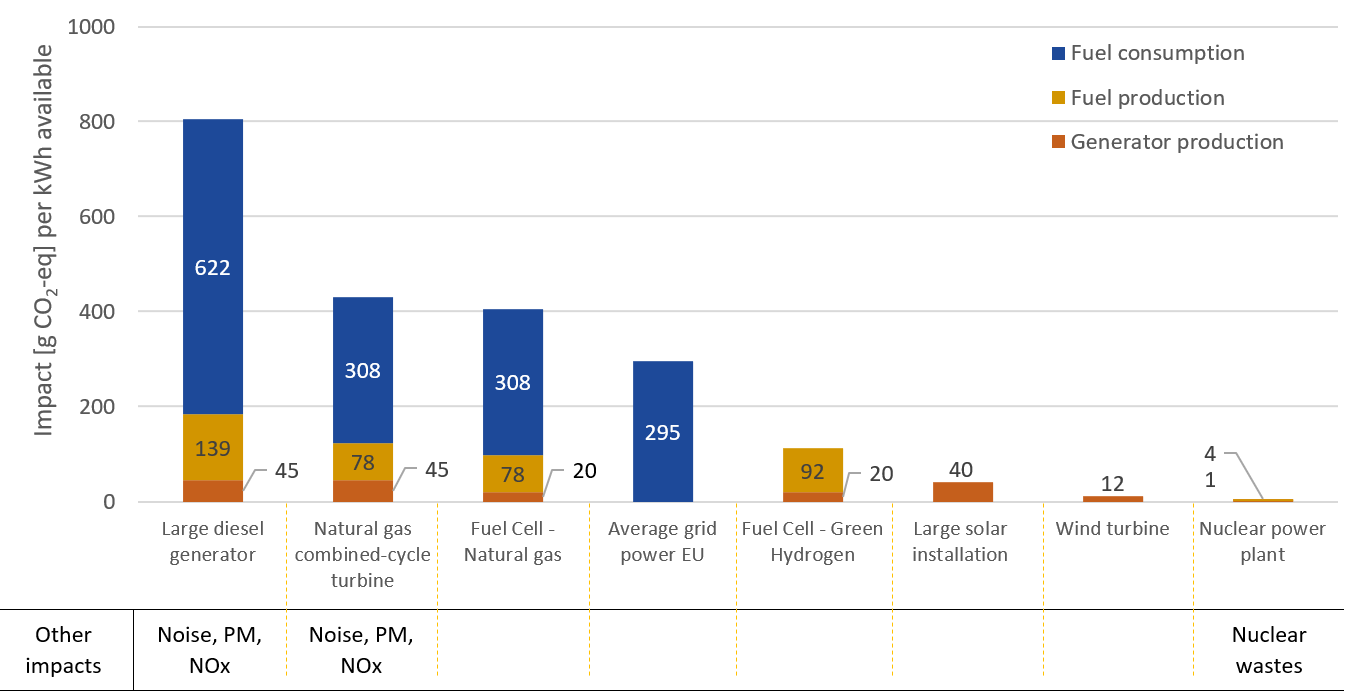
- Utility scale power, usually composed by larger and more efficient production means.
Total greenhouse gas impact per couple of generator-fuel are presented in the two following graphs:
If you were seeking for a 5 min read, you reached your goal here. The annexes explain how we reached these numbers in a more detailed way.
If you’re interested by what we do and how can our solutions reduce off-grid CO2 impact, just visit our website:
Annexes
Annex A: units used and description
The units used in this analysis are:
- Kg CO₂ equivalent [kg CO₂-eq]: for example, 100km in a small diesel SUV results in 37 kg CO₂-eq
- Kilowatt [kW]: is the standard energy unit. 1 kW is equal to 1’000 Watt power. 1 Watt allows the lifting of 100g (a chocolate bar) 1 meter in 1 second. Therefore, a kW allows the lifting of 100kg1 meter in 1 second.
- Kilowatt-hour [kWh]: is the standard energy unit. To take a physical image of a kWh, it’s the energy required to lift a small car (1.2 ton) to the top of the Eiffel Tower or to keep a microwave oven running at maximum power 1 hour.
- Kilowatt peak [kWp]: is the standard unit for solar panels (also called photovoltaic panels). It is the maximum power produced by a solar panel under optimal standard conditions (1’000 watts/m2 of sun radiation at 25°C).
Annex B: Generator manufacturing and transport impact
Several aspects are usually considered to define the impact of power generator manufacturing and installation:
- Impact linked with the material needed for the manufacturing e.g. steel or ceramics
- Energy needed for each production step (manufacturing process) e.g. thermal treatment or machining of metal
- Transport and installation e.g. transportation and installation on-site of a wind turbine.
The CO₂-eq impact associated with the manufacturing and transport of a generator is then usually divided by the total energy expected to be produced during its lifetime. It allows the definition of the overall impact in CO₂-eq per kWh produced by the generator, associated with its production.
An example might be the production of a 1 kWp power solar panel (~5.6 m2) which has an impact of ~1’400 kg CO₂-eq and is expected to product 29’750 kWh of energy during its lifetime. The resulting impact is ~47g CO₂-eq per kWh of energy produced (=1’400 kg / 29’750 kWh).
| Type of generator | Manufacturing and transport impact | Energy production during lifetime | Impact per kWh [g CO₂-eq / kWh] |
|---|---|---|---|
| Solar panel | 1350-1450 kg CO₂-eq per kWp | 29’750 kWh per kWp | 45 to 50 |
| Wind turbine | 600-700 kg CO₂-eq per kW | 60’000 kWh per kW | 9 to 13 |
| Diesel generator | 360 kg CO₂-eq per kW | 8’000 kWh per kW | 45 |
Solid Oxide Fuel Cell (SOFC) | 500 kg CO₂-eq per kW | 20’000 kWh per kW | 25 to 35 |
| Proton Exchange Membrane Fuel Cell (PEMFC) | 200 kg CO₂-eq per kW | 15’000 kWh per kW | 13 |
| Lithium batteries | 140 kg CO₂-eq p er kWh of capacity | 800 kWh per kWh of capacity* | 175 |
*Lithium battery is considered as a generator using directly electricity as fuel here
Note that Proton Exchange Membrane Fuel Cell (PEMFC) is most used in the automotive industry but can only use ultra-pure hydrogen. Solid Oxide Fuel Cell (SOFC), like the one we develop at Inergio, has high operating temperature and can use several fuels not just hydrogen.
An important point here is that if a solar panel for example is under used, its impact per kWh will grow, e.g. a solar panel used only at 20% of standard conditions will have an impact of ~235g CO₂-eq per kWh of energy produced.
Solar panel (photovoltaic panels or PV)
| Description [unit] | Value |
|---|---|
| Harmonized PV production [kWh] on lifetime per m2 | 5355 |
| [m2] for 1kWp PV | 5.6 |
| Average impact of PV power [g CO₂-eq / kWh] | 45-50 |
| Resulting production GWP [Kg CO₂-eq] per kWp of installed power | 1350-1450 |
Standardized conditions are:
1’700 kilowatt‐hours per square meter per year (kWh/m2/yr); system lifetime of 30 years; module efficiency of 13.2% or 14.0%, depending on module type; and a performance ratio of 0.75 or 0.80
Sources:
- https://onlinelibrary.wiley.com/doi/full/10.1111/j.1530-9290.2011.00439.x
- https://www.nrel.gov/docs/fy13osti/56487.pdf
Wind turbine
We used a reverse calculation. From the average impact found and the energy produced over lifetime, we deducted the final impact of the production:
| Property | Onshore | Offshore |
|---|---|---|
| Normalized lifetime [years] | 20 | 20 |
| Average capacity factor | 30% | 40% |
| Average impact of wind turbine power [g CO₂-eq / kWh] | 15 | 13 |
| Energy production during lifetime [kWh] per kW of power installed | 52’560 | 70’080 |
| Total [Kg CO₂-eq / kW] | 788.4 | 911 |
| Impact production and installation | 90% | 70% |
| Production impact [Kg CO₂-eq / kW] | 710 | 638 |
Sources:
- https://onlinelibrary.wiley.com/doi/abs/10.1111/j.1530-9290.2012.00464.x
- https://www.climatexchange.org.uk/media/1459/life_cycle_wind_-executive_summary.pdf
Diesel or gasoline electrical generators
| Description | Value |
|---|---|
| Power | 10 kVA |
| Manufacturing | 3300 kg CO₂-eq |
| Transport / installation | 260 kg CO₂-eq |
| Total (prod + install) | 3560 kg CO₂-eq |
| Impact per power unit | 356 kg kg CO₂-eq per kVA |
| Energy produced over lifetime | 80’000 kWh |
| Impact on final energy production (prod + install) | 45 g CO₂-eq per kWh |
| Comment | We take 8’000 hrs at full power |
Sources:
Comparative LCA model on renewable power solutions for off-grid radio base stations, 2010
Solid Oxide Fuel Cells (SOFC)
SOFC being still a pretty new technology, we found very wide range of values:
| Description | Production impact [kg CO₂-eq] | Energy produced during lifetime [kWh] | Impact of production & install on final kWh [g CO₂-eq] |
|---|---|---|---|
| Micro tubular SOFC 100W | 363 | 2’000 | 181 |
| Stack 100kW manufacturing – normal SOFC | 2404 | 4’000’000 | 0.6 |
| SOFC -GT 3kW | 1673 | 60’000 | 28 |
| InoPower 1.0 120W | 84 | 2’400 | 35 |
In general, micro-tubular SOFC manufacturing is more complex, which would explain why the value is so high. In the case of the large SOFC system (100kW), the value in the reverse seems rather low but might be due to the large size of the installation that push down overall impact. The SOFC combine with a gas turbine is likely quite closed to what we estimate for our InoPower 1.0 fuel cell. For SOFC systems, we will consider 25 g CO₂-eq per kWh for large systems and 35 g CO₂-eq per kWh for small systems in terms of emission linked to production and installation of the generator.
Sources:
- Life Cycle Assessment of microtubular Solid Oxide Fuel Cell based Auxiliary Power Unit systems for recreational vehicles, 2017
- Comparative environmental profile assessments of commercial and novel material structures for solid oxide fuel cells, 2019
- Environomic design for electric vehicles with an integrated solid oxide fuel cell (SOFC) unit as a range extender, 2017
Proton Exchange Membrane Fuel Cells (PEMFC)
PEM Fuel Cell have been also assessed:
| Description | Production impact [kg CO₂-eq] | Energy produced during lifetime [kWh] | Impact of production & install on final kWh [g CO₂-eq] |
|---|---|---|---|
1kWe PEMFC system | 112 | 20’000 | 6 |
| 80kW PEFMC for automotive | 16’000 | 1’200’000 | 13 |
Example of 1kW system seems rather low as it’s lower power compared to the 80kW and lower impact so we won’t really consider it. In general, for PEMFC systems, we will consider 13 g CO₂-eq per kWh produced of emission linked to production and installation of the generator.
Sources:
- Critical materials in PEMFC systems and a LCA analysis for the potential reduction of environ-mental impacts with EoL strategies, 2019
- Life cycle assessment of a polymer electrolyte membrane fuel cell system for passenger vehicles, 2017
Annex C: Fuel production and transport impact
Fuel production and transport, called “well-to-tank impact”, is an important aspect to be considered. For fossil fuels, it’s linked to extraction impact and transport. For green hydrogen for example, it is mainly linked to the electrolysis process energy needed, i.e. to convert water into hydrogen.
| Fuel | Equivalent storage volume | Production related emissions | Fuel’s specific energy (energetic potential) |
|---|---|---|---|
| 1 kg Methane (natural gas) | 250 bar, 6 liters | 1’800 g CO₂-eq | 14,9 kWh |
| 1 kg Propane | 7 bar, 2 liters | 400 g CO₂-eq | 13,8 kWh |
| 1 kg Bio-Propane | 7 bar, 2 liters | 1’300 g CO₂-eq | 13,8 kWh |
| 1 kg Diesel | Liquid, 1.2 liter | 700 g CO₂-eq | 12,7 kWh |
| 1 kg Petrol (gasoline) | Liquid, 1.4 liter | 640 g CO₂-eq | 12,9 kWh |
| 1 kg Methanol | Liquid, 1.3 liter | 500 g CO₂-eq | 5,5 kWh |
| 1 kg Hydrogen – produced by natural Gas steam Reforming | 200 bar, 60 liters | 7’300 g CO₂-eq | 33,4 kWh |
| 1 kg Hydrogen – produced with green energy | 200 bar, 60 liters | 1’840 g CO₂-eq | 33,4 kWh |
| 1 kg Hydrogen – produced with average EU grid | 200 bar, 60 liters | 13’535 g CO₂-eq | 33,4 kWh |
- Methane and hydrogen are stored at high pressure. As hydrogen is a very light element, it still needs 60 liters volume at 200 bars!
- More than 90% of hydrogen is currently produced by natural gas reforming which is in fact not very ecological. Electrolysis is only relevant if renewable energy like solar (45g CO₂-eq per kWh) or wind turbines (15g CO₂-eq per kWh) is used.
Annex D: Operational life-time
- Generators use different kind of energy sources. Some do not generate greenhouse emissions (like sun, wind or hydrogen) and others do (fossil fuels).
- These energy sources are converted to usable energy with a specific conversion factor. This means that only part of the energy source is actually used. Usually, energy loss in the conversion is released as heat. For example, a diesel generator generates useful mechanical energy and usually loses thermal energy.
- The final impact is calculated by defining how much CO₂-equivalent grams are emitted for each kWh of useful energy produced.
- Maintenance impact is often strongly dependent on the use case. For example, for an off-grid power system, whether the maintenance is done by travelling a few kilometers by car or by helicopter considerably changes the impact. We will therefore focus mainly on the impact of the energy source used by the generator.

| Fuel | Total emission* | Fuel’s specific energy (energy per kg) | Total emission per kWh of energy potential |
|---|---|---|---|
| 1 kg Methane (natural gas) | 4’600 g CO₂-eq | 14.9 kWh | 310 g CO₂-eq per kWh |
| 1 kg Propane | 3’350 g CO₂-eq | 13.8 kWh | 244 g CO₂-eq per kWh |
| 1 kg Bio-Propane | 1’270 g CO₂-eq | 13.8 kWh | 92 g CO₂-eq per kWh |
| 1 kg Diesel | 3’850 g CO₂-eq | 12.7 kWh | 304 g CO₂-eq per kWh |
| 1 kg Petrol (gasoline) | 3’940 g CO₂-eq | 12.9 kWh | 306 g CO₂-eq per kWh |
| 1 kg Methanol | 1’860 g CO₂-eq | 5.5 kWh | 340 g CO₂-eq per kWh |
| 1 kg Hydrogen – Natural Gas steam Reforming | 7’300 g CO₂-eq | 33.4 kWh | 219 g CO₂-eq per kWh |
| 1 kg Hydrogen – produced with green energy | 1’840 g CO₂-eq | 33.4 kWh | 55 g CO₂-eq per kWh |
| 1 kg Hydrogen – produced with average EU grid mix | 13’535 g CO₂-eq | 33.4 kWh | 405 g CO₂-eq per kWh |
*Emissions linked with the production and combustion of the fuel
Combining the conversion of a generator with the impact of a fuel, we can define the final impact per usable kWh e.g. gasoline has an impact of 306 g CO₂-eq per kWh of potential energy, if we use a small generator with a 16% efficiency, the final impact per kWh will be 1956 g CO₂-eq (=306 / 16%).
We separate off-grid power generation means (usually smaller and less efficient) with utility scale power generation (usually larger, so more efficient).
| Generator | Fuel | Conversion efficiency | Final emission per kWh of usable energy |
|---|---|---|---|
| Small generator | Gasoline | 16% | 1956 g CO₂-eq per kWh |
| Direct methanol Fuel Cell | Methanol | 26% | 1342 g CO₂-eq per kWh |
| Inergio Fuel Cell (SOFC) | Propane | 35% | 737 g CO₂-eq per kWh |
| Inergio Fuel Cell (SOFC) | Bio-propane | 35% | 239 g CO₂-eq per kWh |
| Small solar installation 20% energy usage* | Sun | 15-20% | 250 g CO₂-eq per kWh |
| Inergio Fuel Cell (SOFC) | Green Hydrogen | 45% | 157 g CO₂-eq per kWh |
*In off-grid setup, solar panels are often oversized for the worst period of the year resulting in low energy usage.
| Generator | Fuel | Conversion efficiency (average values) | Final emission per kWh of usable energy |
|---|---|---|---|
| Large generator | Diesel | 40% | 805 g CO₂-eq per kWh |
| Gas turbine | Natural gas | 60% | 431 g CO₂-eq per kWh |
| Fuel Cell | Natural gas | 60% | 406 g CO₂-eq per kWh |
| Li-batteries power | EU grid power | 90% charge-discharge eff. | 522 g CO₂-eq per kWh |
| Average grid power EU | Various | N/A | 295 g CO₂-eq per kWh |
| Fuel Cell | Green hydrogen | 60% | 112 g CO₂-eq per kWh |
| Large solar Installation | Sun | N/A | 40 g CO₂-eq per kWh |
| Wind turbine | Wind | N/A | 12 g CO₂-eq per kWh |
| Nuclear power plant | Uranium | N/A | 5 g CO₂-eq per kWh |
Annex E: End-of-life and disposal
| Generator type | End-of-life impact |
|---|---|
| Diesel generators | Most materials used can be easily recycled. Electronics is harder to treat but recycling methods are existing and always improving. |
| Fuel Cells aaaaaaaaaaaaaaaaaaa | Most materials used can be easily recycled. Electronics is harder to treat but recycling methods are existing and always improving. The ceramics, even tough they aren’t present in a large amount, are harder to recycle but they don’t represent a risk for the environment and are quite inert. |
| Lithium batteries | This is the negative part for lithium batteries, their end-of-life. 30-40% of the weight comes from cathode material and they are quite toxic for environment. The recycling capabilities are for now not well developed, proportion of recycled batteries variate from 5 to 60% today. There is a huge industry growing to tackle this problem but it will stay likely energy intensive and expensive in the future. >90% of lithium batteries weight can be recycled but current price is economically not viable without subsidies. |
| Wind turbines | Generally, metals present in the wind turbines are well recycled. Electronics is trickier but still can use usual recycling channels without major overloading in the next year. The blades are often made out of composite materials and are the most problematic part as they aren’t well recycled today. This might change in the future. |
| Solar panels | Photovoltaic panels are made mainly of glass, aluminum, silicon and polymer. Even if large scale recycling methods still need to be developed further, most of the components can already be recycled. From 80% to 95% of the material can be recycled depending on the panel type but require some substantial effort. |
| Nuclear power plant | Obviously, end-of-life is the main disadvantage for this power source. Even though it is emitting very low amount of CO₂ per kWh, dismantling of a nuclear power plant is a very tricky operation. This is due to the very bulky structure needed to protect external world from risks coming from the inside and all the radioactive material needed decontamination. The nuclear fuel wastes are also a main concern as they remain very dangerous for more than 25’000 years, without real means to inactivate them. The only solution considered today is secured underground storage in geologically stable areas to avoid leaks in the long term. |
End-of-life and disposal of generators are not a strong focus in this article. The main reasons are that often, it isn’t a very impactful step in terms of Global Warming Potential (GWP) and therefore in CO₂-equivalent..
To come back the conclusions on the top: Summing up

Author: Patrick Biro, COO at Inergio Technologies